Rapid Incident Reponse with PathSolutions Security Operations Manager – Security Field Day 3

As I delve further and further into “all things security” along my career path, it has become clear to me that one of the key skills a good Security Professional must have is the ability to filter out noise, and focus on identifying the critical pieces of information that require action, while safely being able to ignore the rest. Modern security tools, whether they are Firewalls, IDS/IPS, Proxies, Web Application Firewalls, Content Filters, etc. all collect, report, and alert on a lot of information. It can be overwhelming, and this is especially true for smaller, flatter IT teams that perhaps don’t have a dedicated Security Operations Center (SOC), or even an actual Security Team. Quite often, the “Security Team” is one person, and that person may also fill the role of Network Administrator, Server Administrator, or any number of other roles that some larger IT teams might have distributed across several individuals.

In these situations, having a tool or process that can consolidate and help with filtering and focusing the important data is key to being able to avoid information paralysis – the idea of having too much information to really be able to act on any of it in a meaningful way. This is SIEM – or Security Information and Event Management. Now, I’ve found SIEM can be interchangably used as a noun when referring to a specific tool that performs this fuction, or as a verb when describing the act of processing the data from multiple sources into actionable information. In either case, the end result is the most critical – the ability to gather data from multiple sources, and render it down to something useful, and actionable.

This week at Security Field Day 3, I was fortunate to participate in a fantastic conversation with PathSolutions CTO Tim Titus, as he presented TotalView Security Operations Manager and its capabilities as a SecOps tool that can greatly improve awareness and response time to security events within your network.

60 Second Decisions

Investigating alerts can be tedious, and can take up a lot of time, only to find out in many cases that the alert was benign, and doesn’t require intervention. TotalView Security Operations Manager is a security orchastration, automation, and response (SOAR) product designed to optimize event response, reduce wasted time on false positives, and provide a faster path to quarantine and remediation.

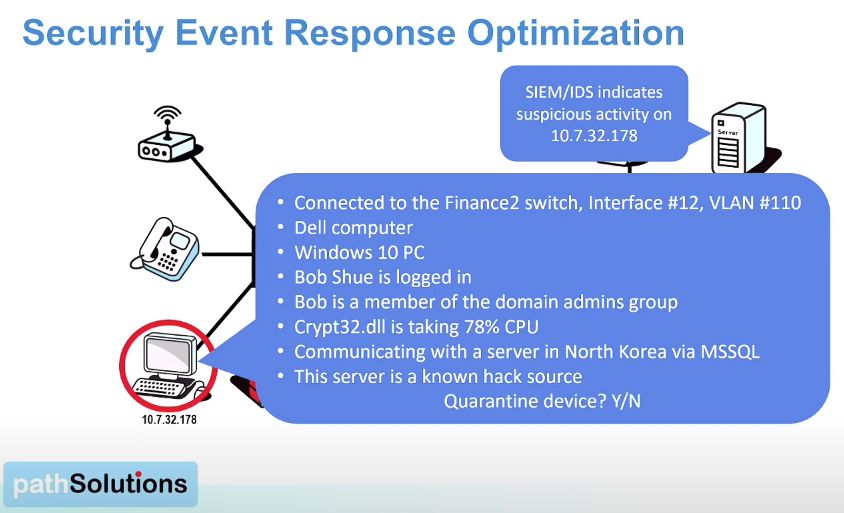
Immediately upon an indication of suspicious activity, the Security Operations Manager dashboard provides almost instant details for the potentially compromised asset: the switch and port it is connected to, what it is (operating system, manufacturer), who is logged into it, what security groups/access they have, what Indicators of Compromise (IoC) are detected, and what destination(s) this asset is talking to on or outside the network, and whether any of these locations could be a known malicious or C&C (Command and Control) destination. With information presented, the option to quickly quarantine the asset is presented, and is as simple as shutting down the switch port with the click of a button. All of this information is sourced natively, with no installed agents, no need for SPAN ports, or network taps. It is all done thorugh NetFlow, SNMP, and WMI (Windows Management Instrumentation).

In roughly 60 seconds, enough information is presented to enable you to make a swift, informed decision on what action to take, and saves countless minutes our hours of correlating information from disparate tools or infrastructure in order to determine if there is in fact a problem. Should this end user workstation suddenly start talking to a known bad IP in North Korea? Probably not! Shut it down.

PathSol_1

Totalview Security Operations Manager doesn’t stop there, and Tim walked us through an in-depth demo of their solution.

Device Vulnerability Reporting

It would be almost too easy to insert a Buzz Lightyear meme captioned with “Vulnerabilities. Vulnerabilities everywhere…” because it’s true. Just a few days ago (as of this writing), Microsoft’s Patch Tuesday saw the release of 111 fixes for various vulnerabilites, the third largest in Microsoft’s history. Keeping up with patches and software updates for any size network can be a daunting task, and more often than not, there is simply not enough time to patch absolutely everything. We must pick and choose what gets patched by evaluating risk, and triaging updates based on highest risk or exposure.

PathSol_4

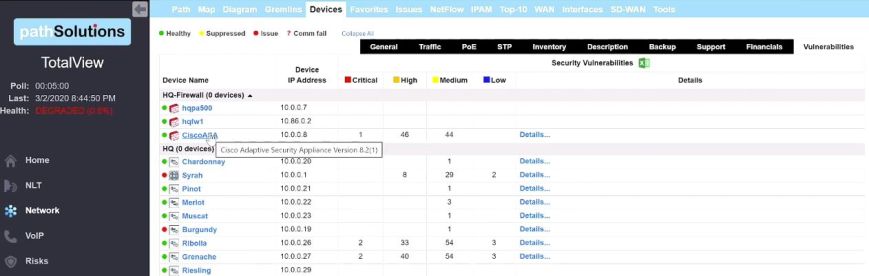
TotalView Security Operations Manager is able to provide constant monitoring of all of your network assets for operating system or device vulnerabilities by referencing the NIST Vulnerability Database (NVD) every 24 hours, identifying those with a known vulnerability, and allowing you to dig deeper into the CVE to assist with risk assesment.

Communications Monitoring and Geographic Risk Profiling

Do you know which of your devices are talking to each other? Do you know where in the world your devices are sending data? These are both questions that can sometimes be difficult to answer without some baseline understanding of all of the traffic across your network. With Communications Policy Monitoring and Alerting, Security Operations Manager is able to trigger an alert when a device starts communicating with another device that it shouldn’t be talking to, based on policies you define.

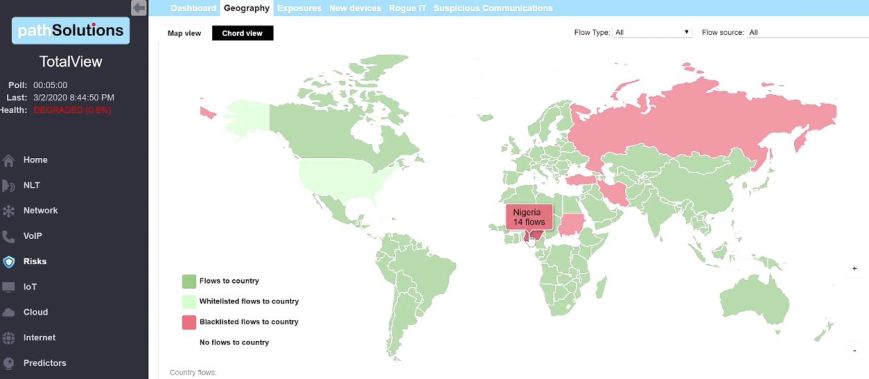
The Geographic Risk profiling looks at where your devices are communicating globally, presented in an easy to understand map view, quickly showing if and when you may have an asset that is sending data somewhere it shouldn’t. The Chord View within the dashboard breaks out the number of flows by country, which presents a nice quick visual, giving you an idea of the percentage of your data is flowing to appropriate vs. questionable destinations.

PathSol_5

New Device Discovery and Interrogation

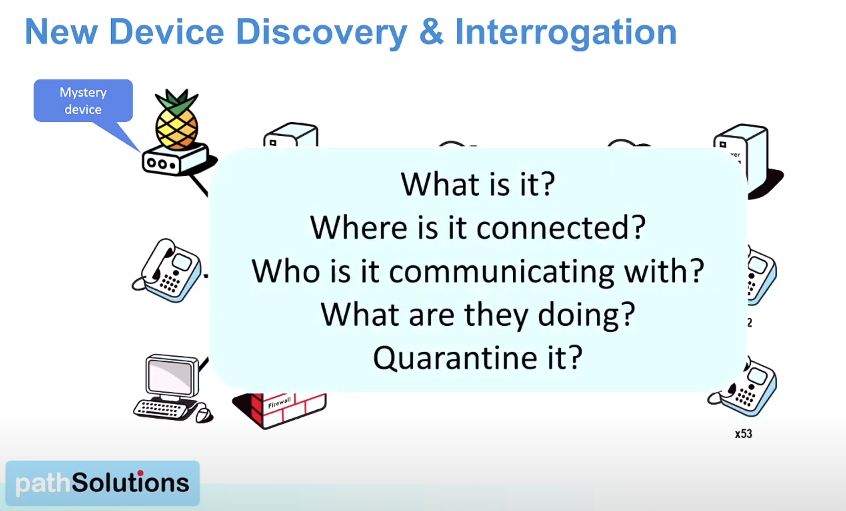
Not everyone has a full Network Access Control (NAC) system in place. Let’s be honest, they’re not simple to set up, and can often be responsible for locking out legitimate devices from accessing the network at inconvenient times. Without NAC, network operators are often blind to new devices being connected. With Security Operations Manager, in the even that new devices are connected, they are discovered, and interrogated to find out what they are, and what they are communicating with. This gives tremendous flexibility to monitor random items being connected, and making it simple to decide on how they should be treated.

PathSol_2

Rapid Deployment

Touting a 30 minute deployment, with only a single 80MB Windows VM required, this seems to good to be true, right? Maybe. There are some dependancies here that, if not already in place, will require some ground work to get all of the right information flowing to the tool. As Tim mentions, there are no requirements for agents to be installed, or taps, but that all of the data is sourced natively via SNMP, NetFlow and WMI. This means, all you need to provide the Security Operations Manager VM is SNMP access to all of your routers, switches, firewalls, gateways, etc. as well as access to the NetFlow data, and WMI credentials for your Windows environment. Setting all of that up, if it’s not already in place, will take some planning, and time. It’s especially important to ensure that SNMP is set up correctly, and securely. Here, the ability of Security Operations Manager to be able to gather 100% of the data from your network relies on the fact that you correctly configured and prepared 100% of your devices for these protocols.

Final Thoughts

Every so often I will come away from a product presentation and really feel like it’s a product that was meant for me, or other folks who find themselves on smaller teams but still managing decent-sized infrastructure. IT teams tend to run slim, and the prevalence of automation, and the need for it have justified some of the lower staffing ratios seen throughout the industry. Less so in large enterprise, but in mid-size or smaller enterprise networks, tools like Security Operations Manager help reduce the noise, and expedite decision making when it comes to monitoring and identifying problematic or compromised devices within the network.

PathSolutions have evolved what began as a tool for network administrators, and added insights for voice/telecom administrators, into a product that now takes all of the data they were already collecting from all of your infrastructure, and boils it down to something quickly parsed and understood by security administrators. Even better if you happen to fill all three of those roles on your infrastructure team.

It’s surpisingly simple, lightweight, and very quick to get up and running. I’m looking forward to diving deeper into Security Operations Manager’s sandbox myself, and invite you to as well.

Check out the full presentation and demo from Security Field Day 3.

Also, feel free to take a look at the PathSolutions Sandbox to try it yourself.

Nerdy Bullets

– All written in C/C++
– Backend storage is SQL Lite
– 13 months data retention (default) – but can be scaled, or descaled based on specific needs
– Data cleanup is done via SQL scripts, and can be customized based on your retention needs
– API integration with some firewall vendors (Palo Alto, as an example) to poll detailed data where SNMP is lacking
– Integrated NMAP to scan devices on the fly
– IP geolocation db updated every 24 hours
– Flow support – NetFlow, sFlow, and (soon) JFlow
– Security intelligence feeds from Firehall

Cisco Catalyst Wifi, Take Two

On November 13th, Cisco announced their next-generation wireless platform with the release of the Catalyst 9800 Series Wireless Controller.

You read that right, the next WLC platform from Cisco is running on Catalyst and expands Cisco’s DNA-Center architecture into the wireless space.

The Catalyst 9800 controllers come in a variety of form factors. The option for a standalone hardware controller is still here with the 9800-40 and 9800-80, or the 9800 series can be run as a VM in a private or public cloud. A third option is now to run embedded wireless on the Catalyst 9k series switches.

Embedded wireless controllers on Catalyst switches…that sounds familiar, doesn’t it?

Cisco made a similar move a few years ago with an architecture called Converged Access. This embedded the wireless controller functionality into IOS XE on the 3650 and 3850 access switches. For various reasons, it did not live up to expectations, and Cisco killed it in IOS XE Everest 16.5.1a in late 2017.

Cisco and Aironet

Cisco acquired Aironet Wireless Communications in 1999 for $799M. Since then, Cisco wireless access points have generally been referred to as “Aironet” products by name. This includes the software that runs on the wireless controllers and access points, AireOS.

AireOS came from Cisco’s acquisition of Airespace in 2005. Airespace were the developers of the AP/Controller model and the Lightweight Access Point Protocol (LWAPP), which was the precursor to CAPWAP.

(Credit to Jake Snyder for correcting me on the origins of AireOS)

Whatever AireOS version is running on your wireless controller is the same that you have on your access points. Cisco has developed the platform to be what it is today, and very little of it remains what was once the original AireOS.

With this iteration, or rather re-invention of the Wireless Controller, Cisco have highlighted three key improvements to their predecessor wireless software.

Always-On

Controller redundancy is always critical to prevent downtime in the event of failure. Here, Cisco are touting stateful switch over with an active standby model in which client state is maintained across the standby controller, offering no downtime for clients in the event of a failure.

Patches and minor software updates now will not change the base image of the controller. Updates can be done without client downtime. Patches for specific AP models can be done without affecting the base image or other access point models with per-AP device packs. These are installed to the controller and then pushed only to the model of AP they are for.

New AP models can also be joined to the controller without impact to the overall base image with the AP device packs, allowing new hardware to join an existing environment without a major upgrade.

Citing “no disruption” base image/version upgrades, the new 9800 controllers can be updated independently of the access points, whereas previously the software version running on the controller and access points was coupled. Upgrades were done to the controller, and then pushed to the access points. More often than not, this resulted in interruption to clients on affected access points, some rebooting of the controller and AP’s was inevitable, and quite often, some orphaned access points that never quite upgraded properly or failed to rejoin the controller.

Cisco have made many improvements to the upgrade process over the years, including staged firmware upgrades, however in large wireless deployments, firmware upgrades would not generally be considered zero-downtime.

With the new controller architecture using an RF-based intelligent rolling upgrade process, Cisco has aimed at eliminating some of these issues. During the upgrade process, the standby or secondary controller is first upgraded to the new image. You can then specify a percentage of access points you would like upgraded at once (5%-25%), and the controller then determines which AP’s should be upgraded using the AP neighbor information and # of clients on each AP. APs with no clients are upgraded first. Clients on access points that are to be upgraded are steered toward neighboring access points in order to prevent interruption in service.

The idea of steering clients to other access points or 5Ghz radios instead of 2.4Ghz radios isn’t new, and because I’m not a wireless expert I won’t comment on exactly how it’s done, but it is my understanding that it is difficult to guarantee that the client will “listen” to the steering mechanism. I feel even with this intelligent RF behind this upgrade process, some clients will inevitably experience a loss of connectivity during the upgrade process.

Once the access point is upgraded, it then joins the already-upgraded controller, and resumes servicing clients.

After all access points are joined to the upgraded controller, the primary controller begins its upgrade process.

Secure

Encrypted Traffic Analytics was first announced as part of the Catalyst 9K switch launch, and uses advanced analytics and Cisco Stealthwatch to detect malware in encrypted flows, without the need for SSL decryption. ETA is now available for wireless traffic on the 9800 platform, if deployed in a centralized model, meaning all wireless traffic is tunneled back to the controller.

This is a great feature considering the only other option for gaining visibility into encrypted traffic is usually some form of sketchy certificate man-in-the-middle voodoo. In many situations this works okay for corporate domain-joined machines as here you can control the certificate trusts, but if you provide wireless to any BYOD devices or to the general public in any way, this often results in people not using your wireless because of certificate issues.

Deploy Anywhere

Cisco is offering a lot of flexibility in deployment options for this new wireless controller.

Branch offices can look at the embedded software controller on Catalyst 9K switches for up to 200 APs, and 4K clients.

Edit: Since the original publication of this post, I’ve clarified that the option to run the 9800 controller on a Catalyst 9K switch is only available as an SD-Access Fabric Mode deployment option. SD-Access requires DNA Center. This is an expensive proposition for what could truly have been a fantastic option for small/medium branch office deployments.

Private or public cloud options are available on KVM, VMware, Cisco ENCS, and will be available on AWS. These options support 1000, 3000, and up to 6000 APs, and 10K, 32K, and 64K clients. The AWS public cloud option only supports FlexConnect deployment models, which makes sense as tunneling all client traffic back to your controller in this case would get expensive quickly.

Physical appliance options include the 9800-40 at 2000 APs, 32K clients and 40Gbps (4x10Gbps interfaces), as well as the 9800-80 at 6000 APs, 64K clients, and 80Gbps (8x10Gbps interfaces). The 9800-80 also has a modular option which allows for GigE, 10GigE, 40GigE, and 100GigE uplinks.

Each of these options have identical setup, configuration, management, and features.

Lessons Learned?

Overall, the presentation of this new wireless platform seems solid. Cisco have acknowledged the problems with Converged Access, and have seem to have checked off all of the missing boxes from that first attempt. Feature parity was a big one, and Cisco insists here that all features will be the same up to the existing controller software version 8.8 (current version is 8.5 at the time if this post), so that would give Cisco and their customers quite a bit of time to flesh out the new architecture.

Now, AireOS isn’t going to disappear suddenly. Cisco have said that they are going to continue to develop and support the existing line of controllers and AireOS software, until they can be sure that this new architecture has been successfully adapted by their customers. Customers who previously bought into Converged Access may not be lining up to be the first customers to try out the new platform, but the popularity of the Catalyst 9K switches should provide a good foundation for the embedded controller to gain a foothold.

You can check out Cisco’s presentation at Networking Field Day 19 here:


Forward Thinkers, Forward Networks.

Maintenance windows. Let’s be honest, they suck. If you ask any network admin they will likely tell you the midnight maintenance windows are their least favorite part of the job. They are a necessity due to the very nature of what we do, which is build, operate and maintain large, complex networks, because any changes that are made can have far-reaching, and often unpredictable impact. Impact to production systems that we must avoid whenever possible. So, we schedule downtime and amp up our caffeine intake for an evening of changes and testing whatever we may have broken.

No matter how meticulous you are in your planning, no matter how well you know the subtle intricacies of your environment, something, somewhere is going to go wrong. Even if you are one of the lucky few to have a lab environment in which to test changes, it’s often not even close to the scale of your actual network.

But, what if you had a completely accurate, full-scale model of your network, and could test those changes without having to risk your production network? A break/fix playground that would allow you to vet any changes you needed to make, which would in turn, allow you the peace of mind of shorter, smoother maintenance windows, or perhaps (GASP!) no maintenance windows at all?

Go ahead, break it.

That’s what Forward Networks’ co-founders David Erickson and Brandon Heller want you to do within their Forward Platform, as they bring about a new product category they call Network Assurance:

“Reducing the complexity of networks while eliminating the human error, misconfiguration, and policy violations that lead to outages.”

At Network Field Day 13, only a few days after Forward Networks came out of stealth, we had the privilege of hearing, for the first time, exactly who and what Forward Networks was, and how their product would “accelerate an industry-wide transition toward networks with greater flexibility, agility, and automation, driven by a new generation of network control software.”

David Erickson, CEO and co-founder, spoke to how they have recognized that modern networks are complex, made up of hundreds if not thousands of devices, are often heterogeneous, and can contain millions of lines of configuration, rules, and policy. The tools we have to manage these networks are outdated (ping, traceroute, SNMP, etc.) and the time spent as a network admin going through the configuration of these devices looking for problems is overwhelming at times. As a result, a significant portion of outages in today’s networks are caused by simple human error, which has far-reaching impact to business, and brand.

This is not a simulation or emulated model of your network, but a full-scale replica, in software, that you can use to review, verify and test against, without risk to production systems. The algorithm they use claims to trace through every port in your network to determine where every possible packet could go within the network as it is presently configured. The “all packet”.

Applications

The three applications that were demonstrated for us were Search, Verify, and Predict.

Search – think “Google” for your network. Search devices and behavior within and interactive topology.

Verify – See if your network is doing what you think it should be doing. All policy is applied with some intent, is your intent being met?

Predict – When you identify the need for a change, how can you be sure the change you make will work? How do you know that change won’t break something else? Test your proposed changes against the copy of your network and see exactly what the impacts will be.

Forward Search

Brandon Heller offered an in-depth demo of these tools, beginning with Search. Looking at a visual overview of the demo network, he was able to query in very simple terms for specific traffic. In this case traffic from the Internet, to his web servers. In a split second, Search zoomed in on a subset of the network topology, showing exactly where this traffic would flow. Diving further into the results, each device would then show the rules or configuration that allowed this traffic across the device in an intuitive step-through menu that traced the specified path through the entire network, and highlighted the relevant configuration or code.

This was all done in a few seconds, on a heterogeneous topology of Juniper, Arista, and Cisco devices.

Normally, tracing the path through the network would require a network admin, with knowledge of each of those vendors, to manually test with tools like ping and traceroute, and also comb through each configuration device-by-device along the path he or she thought was the correct one, in order to verify the traffic was flowing properly.

The response time on the queries was snappy,  and Brandon explained this was due to the fact that, like a search engine, everything about the network was indexed ahead of time, making queries almost instantaneous.

Forward Verify

It’s one thing to understand how your network should behave, and another to be able to test and confirm this behavior. Forward Verify has two ways of doing this. The first is a library of predefined checks that identify common configuration errors. Things like duplex consistency, etc. that are fairly common, yet easy to miss configuration errors.

The second is with network-specific policy checks. Here once again, a simple to understand intuitive query verified that bidirectional traffic to and from the Internet could get to the web servers over via http and ssh.

When there is a failure, a link is provided which allows you to drill down into the pertinent devices and their configuration and see where your policy check is failing.

Forward Predict

When a problem is identified or a change to the network configuration is necessary, Forward Predict is the final tool in the suite, and in my opinion, the most important one, as it allows you to test a change against your modeled network to see what impact it will have. This is huge, as typically changes are planned, implemented and then tested in a production environment in a change or maintenance window.

Forward Predict, while it may not eliminate the need for proper planning and implementation, allows you to build and test configuration changes in what is essentially a fully duplicated sandbox model of your exact environment. This is going to make those change windows a lot less painful as you already know what the outcome will be, rather than troubleshooting problems that weren’t anticipated when the changes were planned.

Moving “Forward”

A common sentiment among NFD delegates during this presentation was that Forward Networks’ product did some amazing things, however we wondered if there was an opportunity here to move this product one step further and have it actually implement or make the changes to the network, after the changes have been vetted by Forward Predict.

Forward Adjust, perhaps?

Understandably, this is going to involve a lot of testing, especially in light of the fact that Forward is completely vendor-neutral and touts the ability to work with complex, mixed environments. Making changes in those types of environments adds a lot of responsibility to this platform, and with that comes risk. Risk that most engineers might be a little skeptical to entrust to a single platform.

Time will tell, and I look forward to hearing more about Forward Networks’ development over the upcoming months, and see where the Network Assurance platform takes us.

Check out the entire presentation over at Tech Field Day, including a fantastic demonstration from Behram Mistree on how Forward Verify can help mitigate and diagnose outages in complex, highly resilient networks.


Hyperscale Networking for the Masses

In my career I’ve typically been responsible for plumbing together networks for branch, campus, and (very) small enterprise networks that had datacenters that were defined by single-digit rack numbers. So, when I’m reading or watching news about datacenter networking I often have a difficult time putting this into perspective, especially when the topic is focused on warehouse and football field sized datacenters. This might explain why I have not spent a lot of time working with or learning about Software Defined Networking, because it seems to me that SDN is a solution to a problem of scale, and scale isn’t something I’ve had to deal with.

As networks grow, management of configuration and policy eventually becomes ungainly and increasingly difficult to keep consistent. Having to log into 100, 200, even 1000 devices to make a change is cumbersome, and so we as networkers seek to automate this process in some way. There have been applications and tools developed over the years that leverage existing management protocols like SNMP and others to provide a single-pane view to managing changes to your network, but once again these don’t scale to the size and scope that we’re talking about with SDN.

Taken to the extreme, SDN and Open Networking have allowed companies like Facebook and Google to actually define and design their own data center infrastructure, using merchant silicon. The argument here being that Moore’s Law is coming to an end. Commodity hardware is catching up to or has caught up to custom built silicon and the premium that many were willing to pay for these custom ASICs is no longer required in order to stay on the cutting edge of data networking.

Amin Vahdat, Fellow and Technical Lead for Networking at Google spoke about this at the Open Networking Summit earlier this year, and contributed to a paper on Google’s Datacenter Network for Sigcomm ’15. In both presentations, Amin outlines how Google has, over the course of the last 7-8 years, achieved 1.3 Pbps of bisection bandwidth in their current datacenters with their home-grown Jupiter platform. I would encourage you to check out both the video and the paper to learn more.

ONS 2015 Keynote – Amin Vahdat
Jupiter Rising: A Decade of Clos Topologies and Centralized Control in Google’s Datacenter Network

This application of SDN is dramatic. Few organizations have the ability, or need, to develop their own SDN solution for their own use. So how can this same scale-out model be applied to these other, smaller datacenters?

Recently I was invited to attend Networking Field Day 10 in San Jose, and we had an opportunity to visit Big Switch Networks. Rob Sherwood, CTO for Big Switch, spoke about some of the same principals around SDN, citing the Facebook and Google examples, and explained that there was “a tacit assertion that the incumbent vendors, the products that they build do not work for companies at this scale.”

Their solution? Big Cloud Fabric, designed to offer hyperscale-style networking to any enterprise. It is designed around the same three principals seen in Google’s infrastructure:

1) Merchant Silicon
2) Centralized Control
3) Clos Topology

Operating on 1U white-box/bare-metal switches running Switch Light OS, the leaf-spine topology is managed through the Big Cloud Fabric Controller. Several deployment options exist including integration with Openstack and VMware, and based on the current Broadcom chip being used, can scale out to up to 16 racks of compute resources per controller pair. Even if you only have half a dozen racks today, BCF provides scalability, and economy.

You can watch Rob’s presentation on BCF here:

One of the other things Big Switch Networks has done is launch Big Switch Labs, which provides an opportunity to test drive their products and for those of us who don’t work in large(ish) datacenters, a venue for getting your hands on a true SDN product in a lab environment. It’s a great way to gain insight into some of the problems SDN is aimed at solving and provides a fantastic demonstration of some of the capabilities and scalability that the Big Switch Fabric can offer.

BSLabs

If you’re just getting your feet wet with SDN, and/or Open Networking and want a brain-melting crash course on how it operates and scales in some of the world’s largest, most powerful datacenters, give Big Switch Labs a test drive. Big Cloud Fabric provides datacenter management and control modeled around the same principals as other massive hyperscale fabrics, but designed to be “within reach” for today’s enterprise customers and their own datacenter workloads.